Gold Pulls Back Following Reaching 1.618 Fibonacci Extension
The weekly chart for gold shows that it’s been going up a lot, reaching new highs easily. Even though the Fed might not cut rates as much and the US dollar is getting stronger, gold is still doing really well. This is because central banks are buying a lot of gold, and people in China are buying more too.
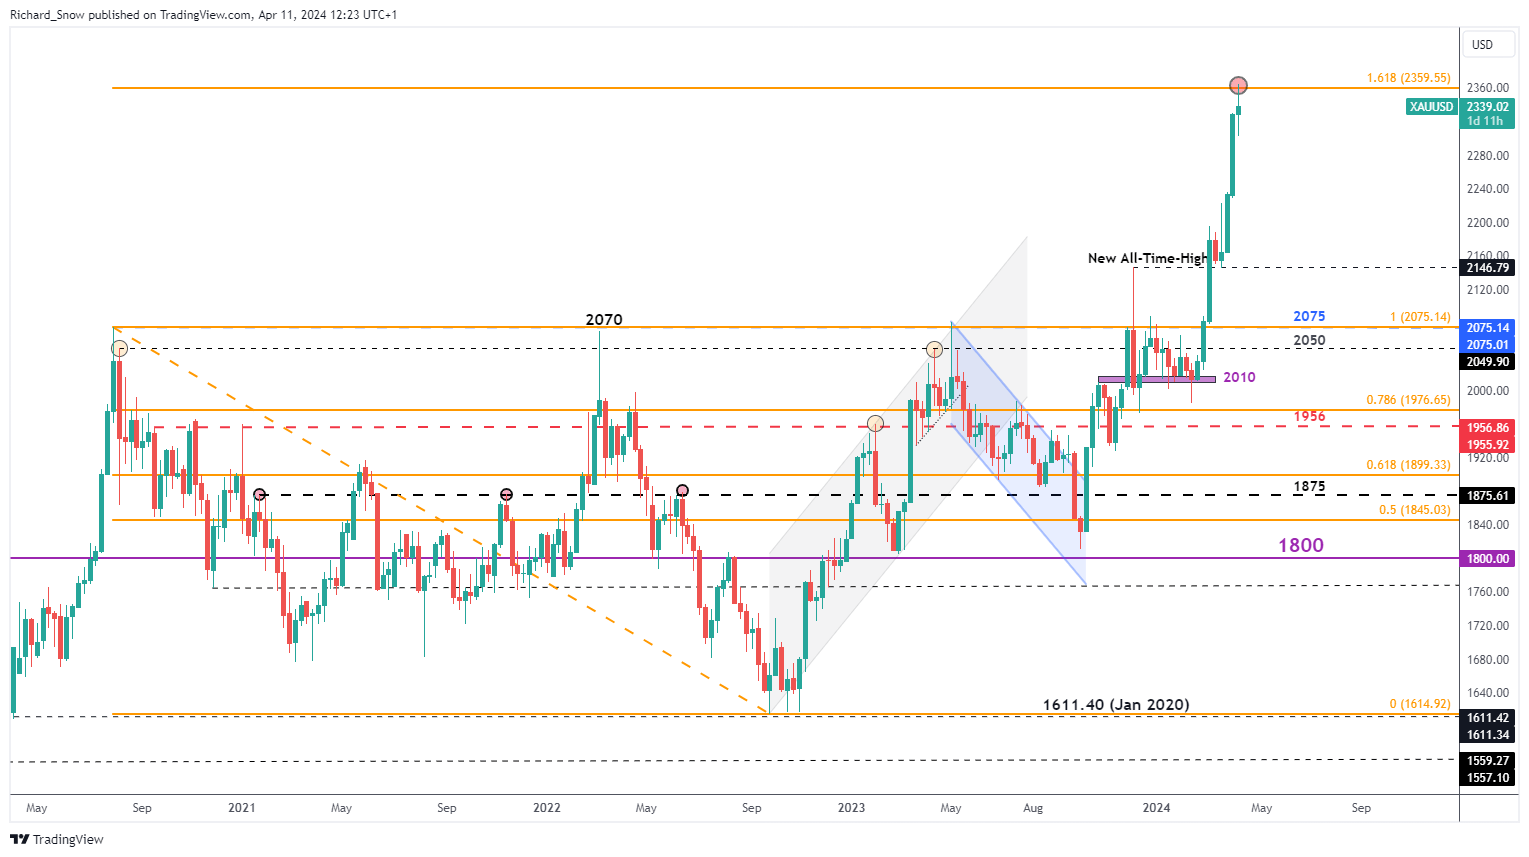
Since gold is hitting new highs, it’s hard to say where it might stop. But one way to guess is by looking at the 1.618% extension of a big drop in gold prices from 2020 to 2022. This suggests that the next big challenge for gold could be reaching $2360. Right now, gold seems to have moved a bit away from this level, but it’s not a big move yet.
GOLD WEEKLY CHART
Looking at the daily chart, we can see that the gold market is getting really hot. The RSI, which shows how fast prices are changing, is still in the “overbought” zone. Prices are also much higher than both the 50-day and 200-day moving averages, which is good news for gold.
Today, gold seems to be settling down after yesterday’s news that the Consumer Price Index (CPI) was higher than expected. This made yields and the dollar go up, which made gold more expensive for people in other countries.
Gold has been going up really fast, so if it goes back down to its old high of $2195, it might mean that the upward trend isn’t as strong anymore. Even if it goes down to $2222, it doesn’t necessarily mean that the upward trend is over, but it might make people think again about whether gold will keep going up.
Silver Faces Resistance at Previous Long-Term Level
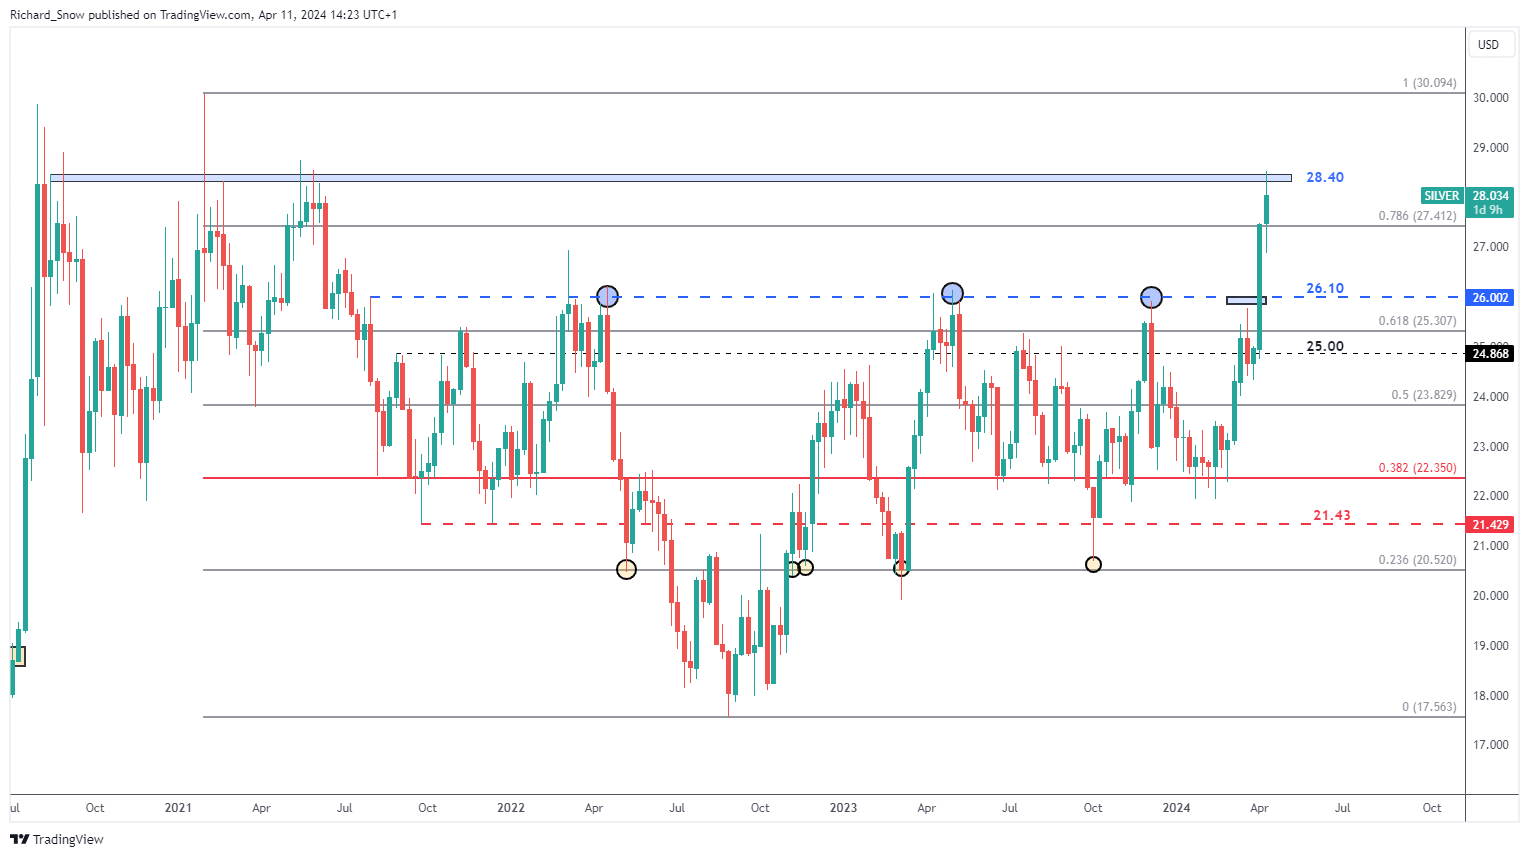
Just like gold, silver has been going up a lot lately. But it’s hit a point where it’s having trouble going higher. This same point was a problem for silver back in late 2020 and early 2021, when it was around $28.40 during the Covid pandemic. The next goal for silver is to reach $30.10, which would mean it’s gone all the way back up from where it went down in 2021 and 2022.
If silver can’t go higher from here, it might start going down again. In that case, the next levels to watch out for are $27.41 and then $26.10.
SILVER WEEKLY CHART
Looking at the daily chart, we can see that the recent price movements for silver seem to be settling down just below the resistance area. The RSI indicator is showing red, indicating that silver is still in the “overbought” zone, suggesting that buyers might need to take a break for a bit.