
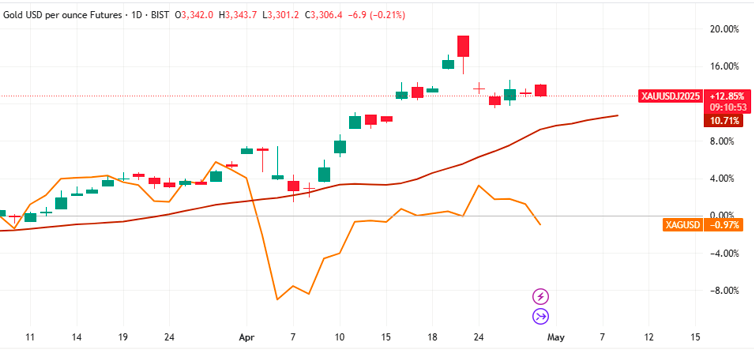
Gold price forecast weakens over 1% as traders await critical US GDP and PCE data. Gold (XAU/USD) fell sharply during the European session on Wednesday, dropping over 1% toward $3,275. Traders held back on gold positions, awaiting US data that may sway Federal Reserve decisions. This pullback follows recent profit-taking and improved market sentiment on global trade, signaling a temporary slowdown in gold’s recent rally.
Key Highlights for Gold Price
- Gold price dips over 1% to $3,275 amid reduced risk appetite and profit booking.
- Market awaits US Q1 GDP and March PCE data for rate policy clues.
- US GDP expected at 0.4% versus Q4’s 2.4% expansion.
- President Trump eases auto tariffs, calming trade tensions.
- Technical levels indicate downside risks unless bulls reclaim $3,322.
Gold Price Forecast: Market Focus Turns to Key US Economic Reports
Wednesday’s price decline comes after US President Donald Trump signed an executive order easing tariffs on imported car parts. His announcement emphasized progress in trade discussions, helping reduce broader economic uncertainty. This softer tone from Washington has taken pressure off risk-averse assets like gold.
President Trump once again criticized Jerome Powell, casting doubt on the Federal Reserve’s leadership and direction.
Trump claimed he understands interest rates better than Powell, reigniting tensions over the Fed’s current strategy. As tensions between the Fed and the White House resurface, market expectations remain focused on whether upcoming data will justify a policy shift in May.
Gold Technical Analysis: Bullion Approaches Critical Support Levels
Gold price forecast failure to hold above the $3,300 mark reflects bearish short-term sentiment. The price now tests immediate support near $3,295 (S1). A stronger downside move could lead to a retest of $3,245, a key level marked by the April 11 high.
To regain momentum, bulls must reclaim $3,322 (pivot), followed by resistance at $3,344 (R1) and $3,370 (R2), which would open the path toward $3,400. However, unless US data disappoints significantly, gold may struggle to stage a convincing rebound.
Investor Sentiment and Flows
Gold-backed ETFs saw significant inflows during Q1, with investors adding about 227 tons, according to the World Gold Council. This was the highest since 2022, pushing prices to record highs. However, recent flows suggest caution. Indian jewelry sales dropped in March and may decline 11% by fiscal year ending March 2026.
Upcoming Data: GDP and PCE in Focus
The US is set to release preliminary first-quarter GDP data today at 12:30 GMT. Analysts expect a meager 0.4% growth rate, well below the previous quarter’s 2.4%. The monthly Personal Consumption Expenditures (PCE) inflation data for March is also due.
Core PCE is forecast to decline to 0.1% from 0.4%, while the headline figure may fall to 0%, signaling easing inflation pressures. A weaker GDP combined with soft inflation data could reignite demand for safe-haven assets like gold.
Expert Insight and Outlook
Analysts warn that a lower GDP print could prompt renewed rate cut speculation, offering near-term support for gold. However, without a major downside surprise, technical momentum remains bearish. “A sustained move below $3,275 could open the door toward $3,245,” one market strategist noted. “Any surprise action from the Fed or renewed trade tensions would be required to push gold sharply higher again.”
Conclusion: Cautious Sentiment Amid Key Data Releases
Gold prices are under pressure as traders await vital economic indicators. Market participants remain cautious, balancing recent signs of easing trade tensions with potential shifts in Federal Reserve policy. The next moves in bullion will largely depend on how US GDP and inflation figures shape market expectations.
For ongoing insights and real-time updates, visit Daily Gold Signal.
Read more in our Daily Gold Update section.
Frequently Asked Questions (FAQs)
1. Why is the gold price dropping today?
Gold prices dropped over 1% due to profit-taking and anticipation of key US economic data.
Markets are watching the GDP and PCE reports, which may affect future Federal Reserve decisions.
2. What is the gold price forecast for this week?
The gold price forecast remains cautious with a bearish bias unless $3,322 resistance is reclaimed.
A weaker-than-expected US GDP could offer support, while strong data may push prices lower.
3. How do US GDP numbers affect gold prices?
Lower GDP growth weakens the dollar and may lead to rate cuts, boosting gold demand.
Higher growth suggests rate hikes or stability, often pressuring gold as investors shift to risk assets.
4. What are the key support and resistance levels for gold?
According to gold technical analysis, support lies at $3,295 and $3,245 on the downside.
Upside resistance starts at $3,322 (pivot), followed by $3,344 (R1) and $3,370 (R2).
5. How have gold-backed ETFs performed recently?
Gold ETFs saw inflows of 227 tons in Q1, the highest since 2022 per World Gold Council.
This indicates strong investor interest, though recent caution reflects changing market dynamics.